
A promise to reduce waits for patients
Labour pledged to make the NHS it’s number one priority and specifically to reduce the 7.6m waiting list.
It’s been another big month for the new Government. Following on from the party conference, attention now turns to what is being trailed as a “difficult” budget on October the 31st. And the solemn tone has us all bracing ourselves for a few scares more than we bargained for.
There was very little by the way of clues given away at the Labour conference. But will the coming budget reveal the investment behind delivering the waiting list pledge and inspire some welcome hope?
Fresh analysis with some context on demand
In preparation, MBI’s research team have carried out exclusive analysis into waiting list growth rates at every NHS hospital in England from the start of this financial year in April 2024 to now and the results are a stark warning of the challenge ahead.
The first point to be aware of is that demand from primary care to secondary care has increased – on average by 5% compared to last year.
On that basis, hospitals who are managing to hold growth at or around 5% are doing ok. Those above that 5% less so.
What does waiting list growth look like?
Nationally, whilst the average level of growth this year to date (YTD) is running at just 1% – this masks some huge variations at hospital level and waiting time level.
For example, the top 5 Trusts with significant growth are shown below:
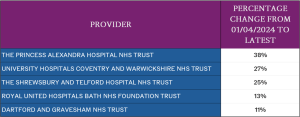
Fig. 1: English hospitals with the highest waiting growth financial YTD
Getting your priorities right
Current NHS operational guidance remains stubbornly focussed on removing long wait patients, at the expense it seems of everything else.
Specifically, the NHS wants to eliminate over 65 week waits in September (which it won’t achieve). These patients represent about 2% of the overall waiting list size yet the resources and attention they get are disproportionate in comparison the rest of the waiting list.
Worse still is the very longest waits (over 78 weeks) is a tiny number of the overall waiting list – roughly 4,300 which is 0.06% of the total waiting list.
Patterns and examples
If, for example, we choose the top 3 hospitals with the biggest areas of growth YTD and look at what their long wait position is, we see exactly the problem:
- The Princess Alexandra Trust, has seen a growth in waiting list of 38% in just 6 months. However, the number of patients waiting excessively long (over 78 weeks) is just 5.
- University hospital Coventry and Warwickshire, with growth of 27% has just 10 patients over 78 weeks.
- Finally, Shrewsbury and Telford, with growth at 25% has 96 patients over 78 weeks.
This is not to say these extreme waits are unimportant – they should absolutely not happen but the point here is the bigger issue is not being dealt with – stopping the problem getting worse.
The organisations highlighted in Figure 1 have growth rates well outside normality and yet very few of them are on the radar of NHSE because they do not have an issue with excessively long waits.
To take our analysis one stage further, we looked at the waiting times where growth is high and identified where exactly on the waiting list the growth is occurring.
Our results proved conclusively that policy is driving poor behaviours.
For example, at Coventry and Warwickshire, growth in the waiting list occurred in two places:
- Firstly, patients waiting between 10 and 18 weeks.
- Secondly, the middle of the PTL – wait 18-40 weeks.
Because all resource is going into keeping excessive waits off the list, those coming behind are not being managed. It’s very clear that the resource is going into ensuring long waits are reducing but not focussed on the rest of the waiting list.
This pattern is replicated across all hospitals in the list with some of them showing huge increases in short waiting patients as well. Despite this obvious trend, all resources are being pointed at the small number of excessive waiters.
If we focus on patients waiting 10-18 weeks the results are startling:
- Nationally, the average level of growth for short waiting patients this year to date (YTD) is running at 12% – way above the average level of demand.
- Only 4 Trusts have managed to reduce this part of their waiting list.
- 14 Trusts have managed to hold growth below the 5% average increase in demand level.
- 97 hospitals have seen growth of between 6 and 20% – higher than average demand.
- 20 hospital Trusts have seen growth of over 20% in the last 6 months.
- For these 20 hospitals the average rate of growth has been 27% in short waiting patients.
The data suggests the wrong areas of the list are being prioritised.
Why are we seeing growth above the levels of demand?
There are a few potential reasons why waiting list growth could exceed demand. Let’s look at them in priority order:
1. Data Quality
To put it simply the growth isn’t real – a lack of data quality controls means poor quality information is not being removed from the list in a timely manner.
2. Critical Events
Sometimes a major change such as the introduction of a new IT system can lead to waiting list growth. This is closely tied to data quality and suggests the implementation of the new system has gone wrong causing false patients to appear on waiting lists.
3. Resource
No hospital in the country can manage every single patient on their waiting list every day. Resource is finite. That means they must choose where to place resource. At the minute, policy is forcing them to place it on the smallest numbers of patients at the very end of the list.
In our experience, numbers 1 & 3 are the root cause. Less often is 2 but when IT system change goes wrong it often goes badly wrong and takes a huge effort to correct.
Conclusions
In light of the recent Darzi review, both the Prime Minister and Health Secretary stated the NHS needed “radical” reform. Whilst this is true in some respects, it misses an important point:
The basics are not being done.
There is no silver bullet to solving this, it will take a thousand different small improvements all happening in tandem.
To summarise:
- Halting waiting list growth should be an NHS priority, obviously with a view to reducing growth ultimately.
- Our analysis clearly shows that waiting list growth cannot be explained by increased demand.
- The current policy of focussing huge resource on long waits is not working.
- In areas where growth appears excessive, the accuracy of the list gets worse as it grows, masking the underlying true position.
- Approaches to data quality and waiting list management need a rethink.
Our hope is that this analysis will drive change and policy. Improvement can be made but requires clear thought and determined action.
In years gone by, that wouldn’t be radical but perhaps in today’s NHS malaise, it is.
See where you stand and find out more
You’ll likely want to know where your organisation sits in our analysis.
If you’re curious about any aspects of the article, then please get in touch and we’d be glad to discuss.
