
Have you ever looked at the published RTT statistics and wondered why the waiting list numbers don’t seem to “add up” from one month to the next?
There’s a reason, and it highlights a persistent and costly issue for NHS Trusts across England.
Every month, thousands of patient pathways are removed from the RTT waiting list without reaching a valid clock stop. These are not completed treatments but corrections.
These removals are technically a subset of “Removals Other Than Treatment” (ROTT), but only a subset. Some removals that do not involve treatment still include a valid clock stop. For example, where diagnostic tests show no concerns and the patient is discharged back to primary care, the pathway ends correctly and is counted as a clock stop.
However, the pathways we are referring to are those removed without any clock stop event recorded. These often arise due to earlier administrative errors, duplicate records, or the incorrect inclusion of patients on RTT pathways in the first place. They are effectively retrospective corrections to bad data.
The Scale of the Problem
To illustrate, consider the national statistics for March 2025:
End of February RTT waiting list: 7,402,148
+ Clock starts (March): 1,798,503
− Non-admitted clock stops: 1,207,339
− Admitted clock stops: 327,477
= Calculated March 31 list size: 7,665,835
However, the reported RTT waiting list at the end of March was 7,420,899, which is 244,936 pathways fewer than expected.
This discrepancy is not a one-off. As shown in Figure 1, it has occurred consistently each month. Around 3% of the total list is being removed each month due to error correction and duplication.
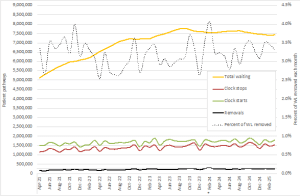
Figure 1: RTT pathway dynamics Apr 2021 to Mar 2025 – England only
Source: https://www.england.nhs.uk/statistics/statistical-work-areas/rtt-waiting-times/rtt-data-2024-25/
Why is this Important?
These removals represent more than a data inconsistency. They are a measure of rework and inefficiency in the system, and a clear example of what’s known as failure demand – activity created by not getting it right first time.
This has a cost. A conservative estimate for validating a single pathway is £3.00 to £4.50. With 245,000 untracked removals in March alone, that equates to between £735,000 and £1.1 million spent on correcting errors each month.
Are Some Trusts More Affected Than Others?
Yes. While the national average for these untracked corrections is around 3%, some Trusts are significantly above this. Figure 2 shows four Trusts that consistently exceed this rate, with some reaching as high as 30%.
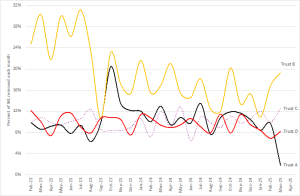
Figure 2: Four Trusts where pathway corrections exceed the norm
This scale of error points to systemic issues in pathway management and highlights the challenge of maintaining performance standards while managing inefficient administrative processes.
Quantifying failure demand in your Trust is the first step towards improvement.
To find out how much failure demand exists in your organisation and what to do about it, you can contact the MBI team here.